Q 4842
for you QAnons...
HERE'S Q ALERT 4842 BELOW:
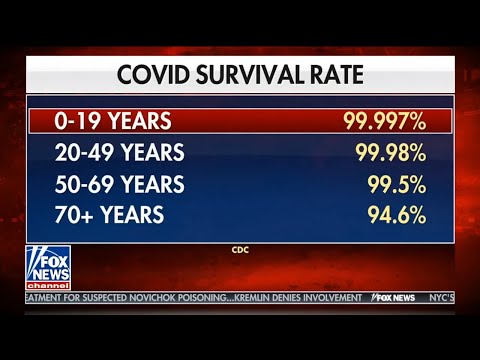
This shows the COVID-19 SURVIVAL RATE and ACTUAL DEATHS of OTHER CAUSES from the CDC: TAKE A LOOK AT THIS:
I DON'T UNDERSTAND HOW THIS IS REALLY PUT TOGETHER AND WHAT IT ALL MEANS...
----------------------------------------------------------------------------------------------------------------------
Q !!Hs1Jq13jV6 ID: 5cc8a9 No.11001092 ![]()
TOTAL U.S. DEATHS [ALL CAUSES]:
2017 Total Deaths US: 2,813,503 (234,000/month)
https://www.cdc.gov/nchs/products/databriefs/db328.htm
2018 Total Deaths US: 2,839,205 (237,000/month)
https://www.cdc.gov/nchs/products/databriefs/db355.htm
2019 Total Deaths US: 2,855,000 (238,000/month)
https://www.cdc.gov/nchs/nvss/vsrr/provisional-tables.htm
2020 Total Deaths US (jan - week 9/26): 2,130,000 (236,000/month)
https://data.cdc.gov/NCHS/Weekly-Counts-of-Deaths-by-State-and-Select-Causes/muzy-jte6
2,130,000 + (236,000/month x 3) [Oct, Nov, Dec] = 2,838,000 [assumption based on monthly avg]
2020: 2,838,000 [3-month assumption insert]
2019: 2,855,000
2018: 2,839,000
2017: 2,814,000
Why did select [D] govs push C19 infected patients into nursing homes?
% of total C19 deaths attributed to nursing home(s)?
Who is most susceptible?
Same [D] govs who pushed C19 infected patients into nursing homes attempting to keep State(s) closed?
Why?
Q